Visualizing real-time Graphs with PuppyGraphBring powerful graph analysis and elegant visualization directly to your data lake
Modern graph visualization tools are essential for making sense of the complex relationships embedded in connected data. Whether you're tracking fraudulent transactions, navigating service dependencies, or mapping cyberattack paths, the ability to visualize graph data helps teams move faster from insight to action.
On this page, we’ll show how PuppyGraph and yFiles work together to enable rich, interactive graph visualizations directly on live data—no ETL required.
Why real-time graph visualization matter
Many teams today store their data in modern lakehouse formats like Delta Lake, Iceberg, or Parquet. PuppyGraph makes it easy to turn this existing data into a graph model and run graph queries directly on it—without having to move or duplicate the data. This real-time capability makes it possible to visualize up-to-date relationships using yFiles, unlocking faster insights and reducing infrastructure complexity.
Whether you're working with security logs, user behavior data, or service dependencies, the ability to visualize graphs without data movement improves accuracy and speeds up investigation.
Unlock real-time Insights with PuppyGraph and yFiles
yFiles gives you the tools to create clear and scalable graph visualizations directly from your PuppyGraph instance. With advanced automatic layouts, you can focus on analyzing and optimizing your graph data instead of arranging nodes manually.
Leverage interactive features, animations, and flexible styling to build dynamic graph applications. yFiles seamlessly integrates with modern web technologies, making it easy to bring your real-time PuppyGraph data to life in any application.
Start visualizing your PuppyGraph data with yFiles today!
Prototype your own graph application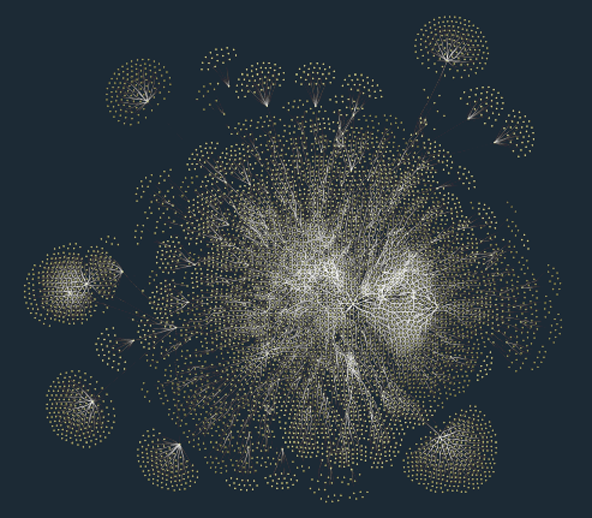

We´d love to help you. Reach out and we'll get in touch with you.
Your message has been sent.
What is PuppyGraph?
PuppyGraph is the first and only real-time, zero-ETL graph query engine that empowers data teams to query existing relational data stores as a unified graph model that is deployed in under 10 minutes. This means you can run openCypher or Gremlin queries over Delta Lake, Apache Iceberg, or Parquet data. It's fast, scalable, and optimized for modern use cases like fraud detection, cybersecurity, and service observability. By removing the need for data duplication, PuppyGraph simplifies architecture, shortens time-to-insight, and makes it easier for analysts to query and understand complex relationships on the fly.
Supported data sources
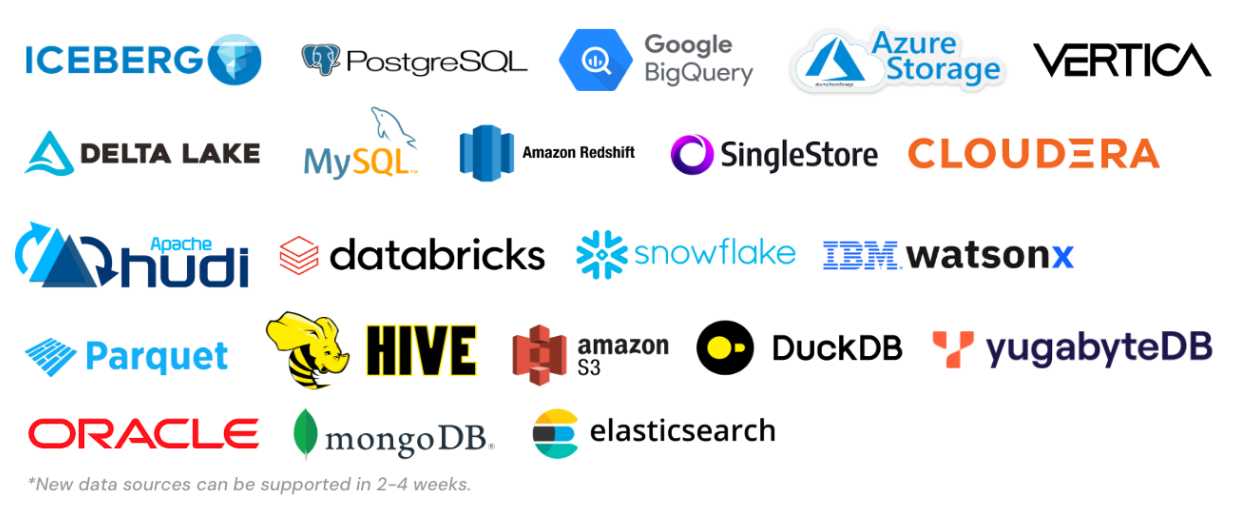
By leveraging the Lakehouse architecture, PuppyGraph uses your existing data store permissions and columnar storage format, applying min/max statistics and predicate pushdown to make queries more efficient—especially for relationship graphs where multi-hop searches and complex joins are the norm.
PuppyGraph is also designed for scale. Its auto-partitioned, distributed architecture handles petabyte-scale datasets with ease, ensuring fast performance even as your graph grows. Whether you're tracking threats, investigating fraud, or mapping service dependencies, PuppyGraph simplifies your stack and accelerates insight.
Visualizing PuppyGraph data with yFiles
yFiles for HTML is a commercial programming library designed for diagram visualization and is perfectly suited for graph database challenges. Its advanced layout algorithms transform your data into intuitive, informative networks. You decide which elements from your database are shown, how they appear, and how users interact with them, enabling bespoke interfaces tailored to your needs.
Tailored visualization & mapping
Easily choose which information from your database to visualize and decide exactly how elements and relationships are represented—whether with arrows, nested hierarchies, or custom structures—to match your use case.
Custom styling & levels of detail
Create unique visual designs for your entities using icons, images, progress bars, or interactive elements. Fine-tune details and content for a visualization that’s always clear and relevant—no matter the data complexity.
Data-driven layouts
Highlight patterns and structures like hierarchies, clusters, or cycles by leveraging a variety of layouts (hierarchic, circular, radial, etc.). With yFiles’ automatic arrangement, your graphs remain neat and readable at all times.
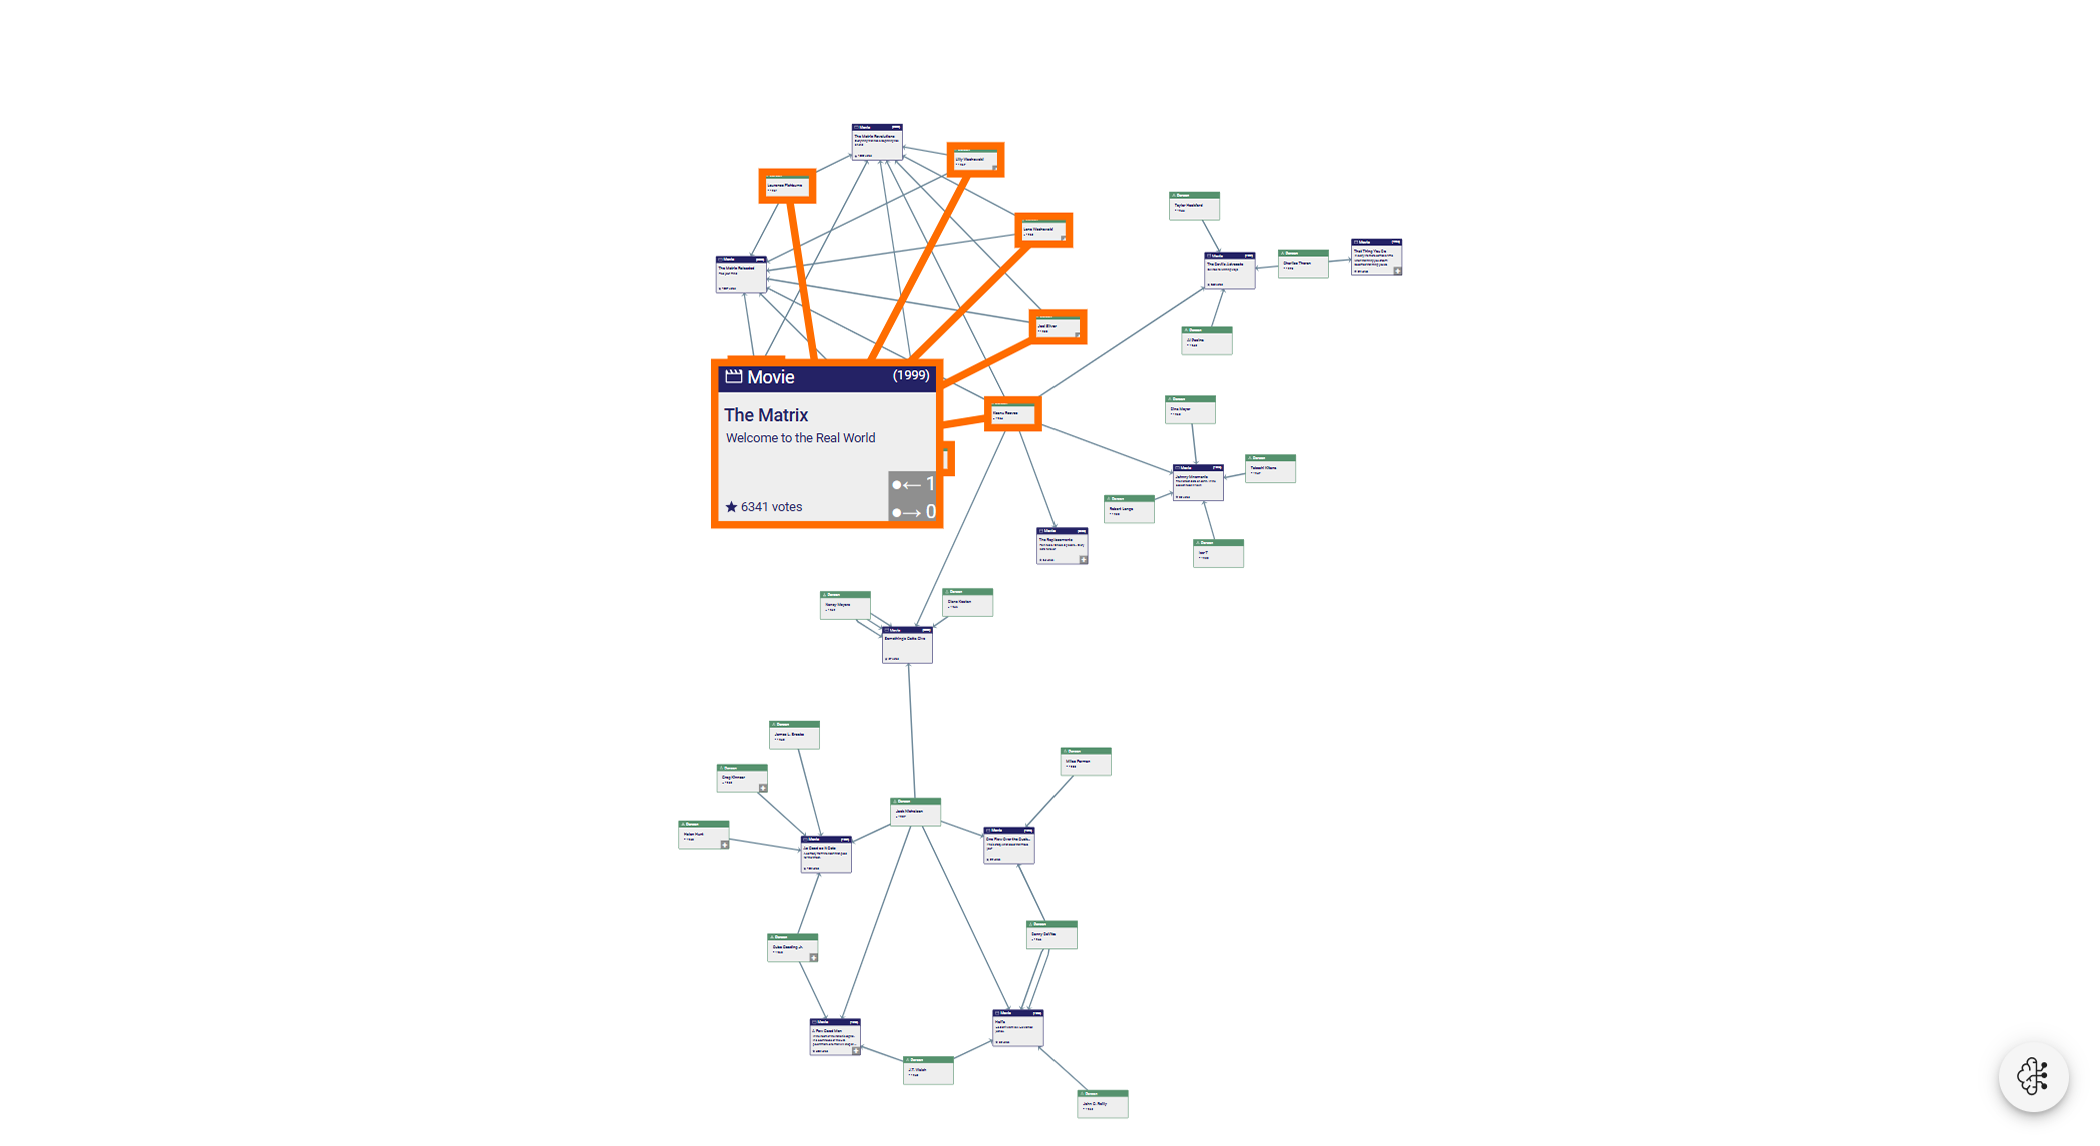
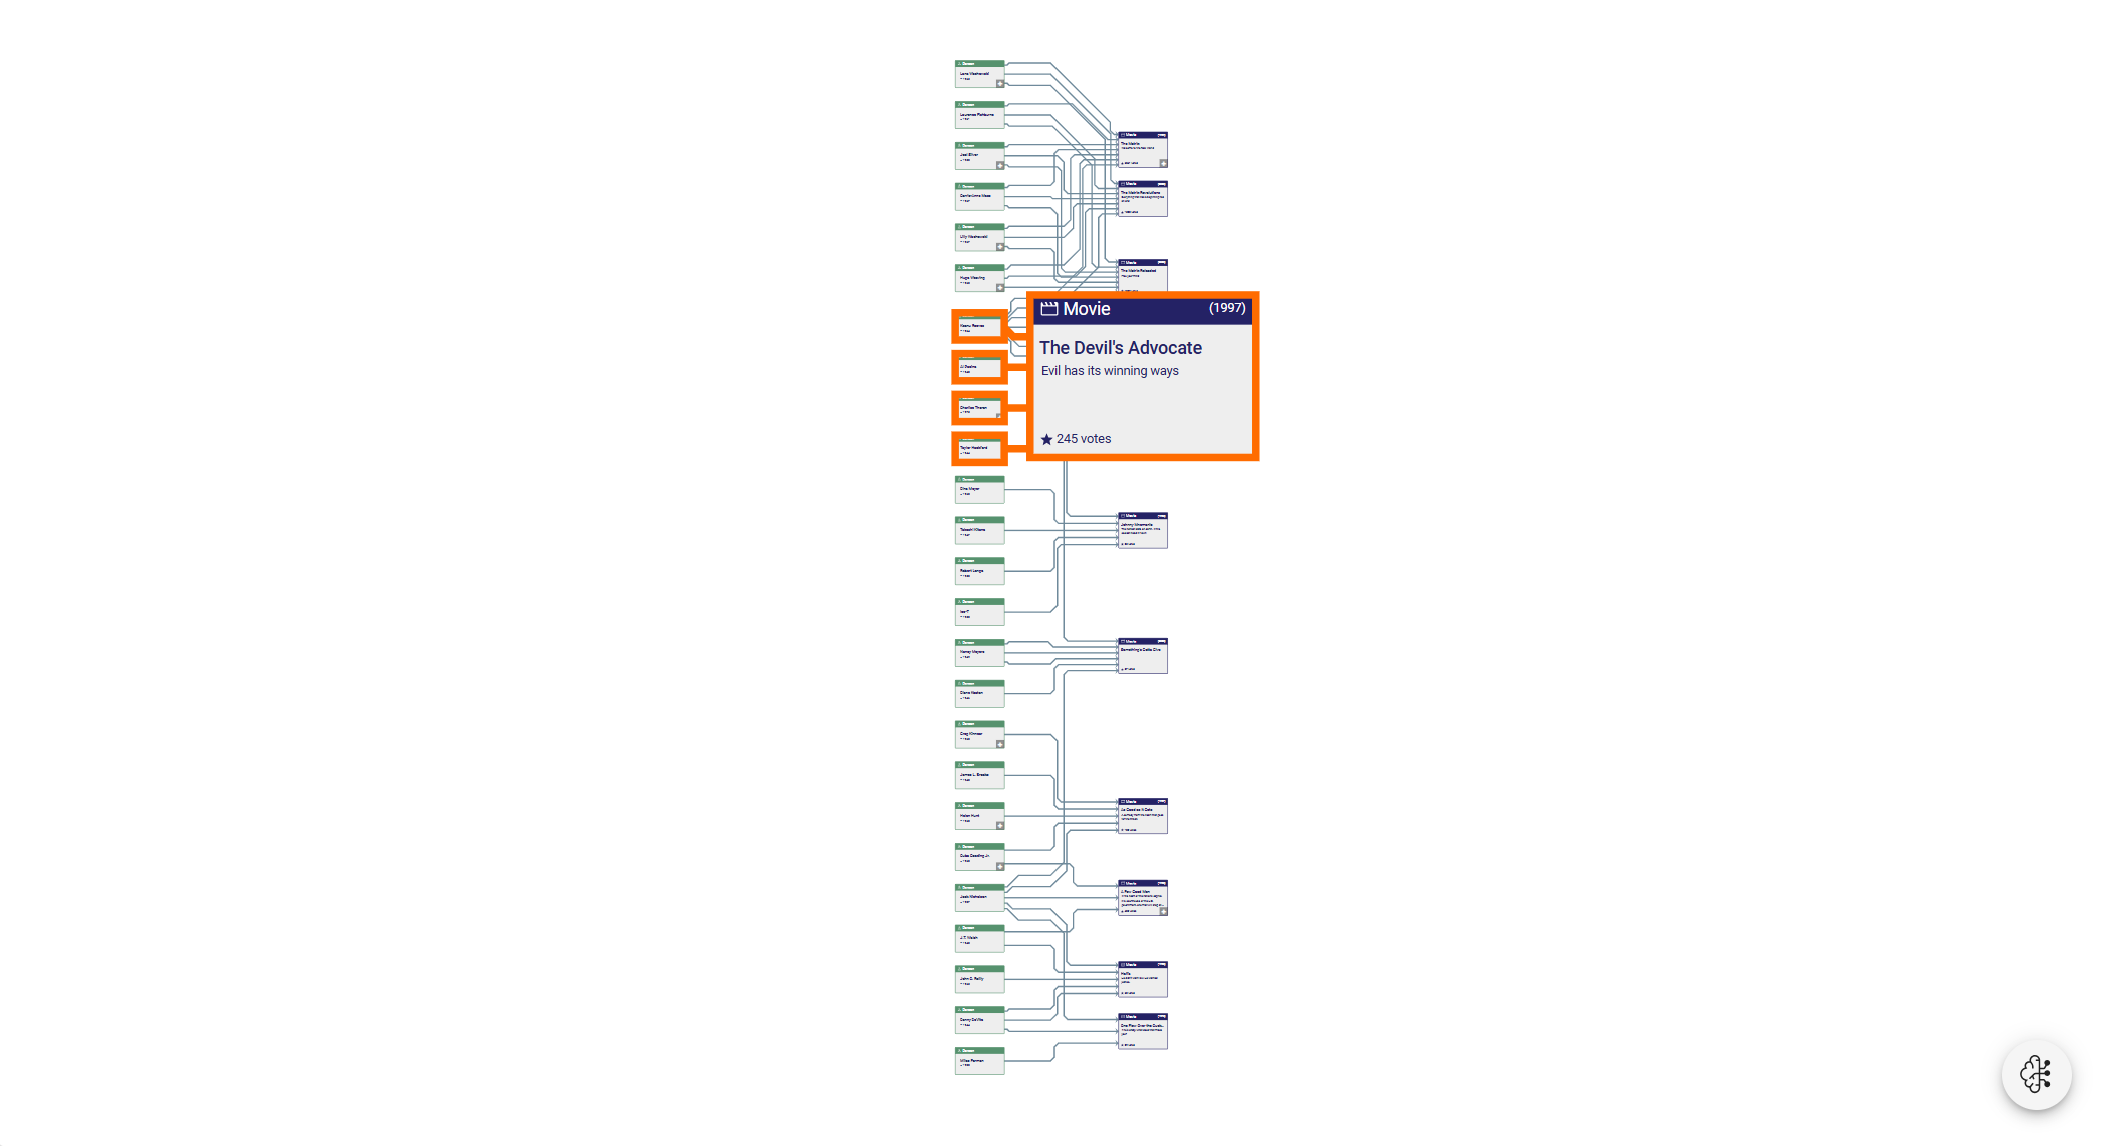
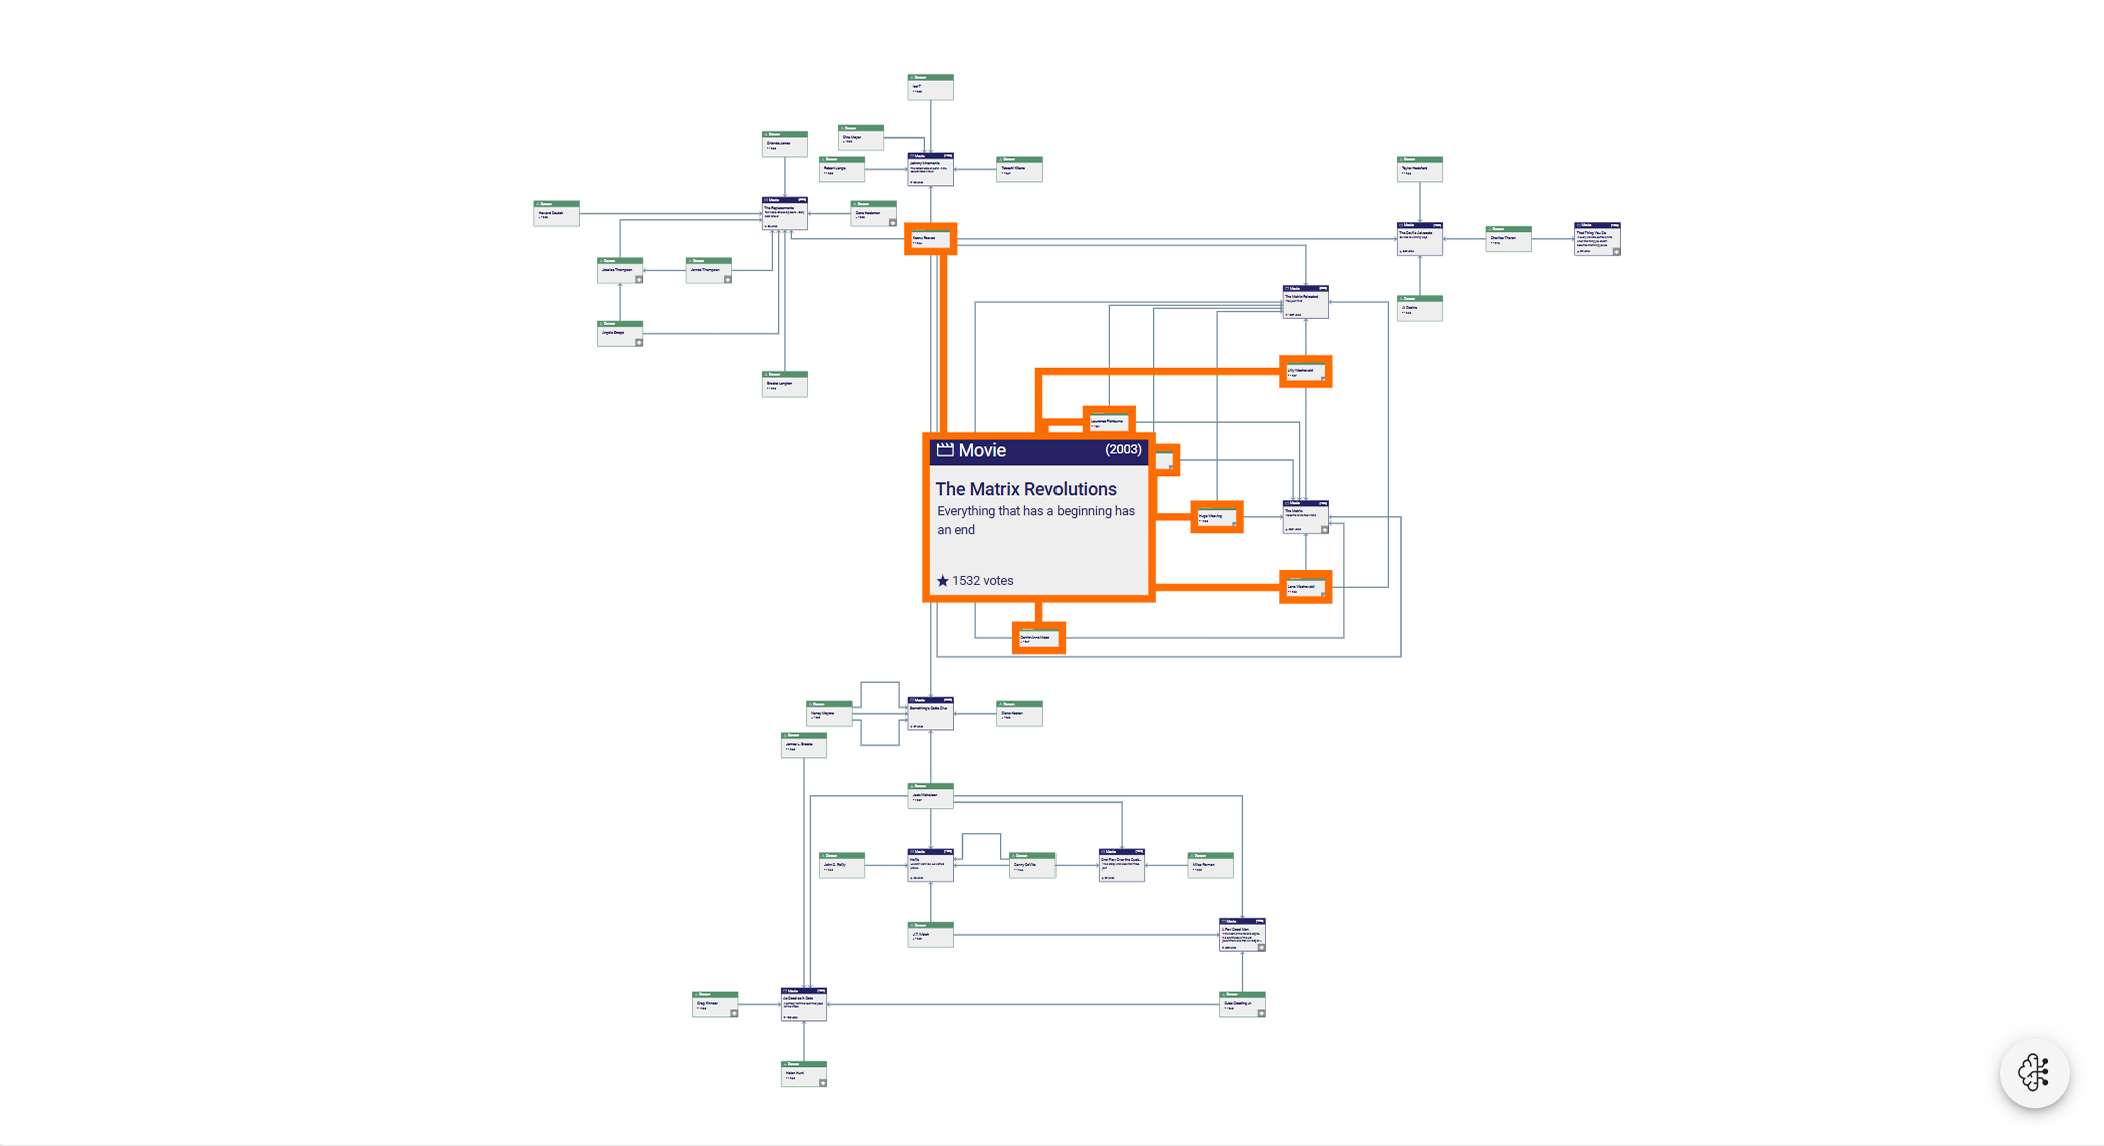
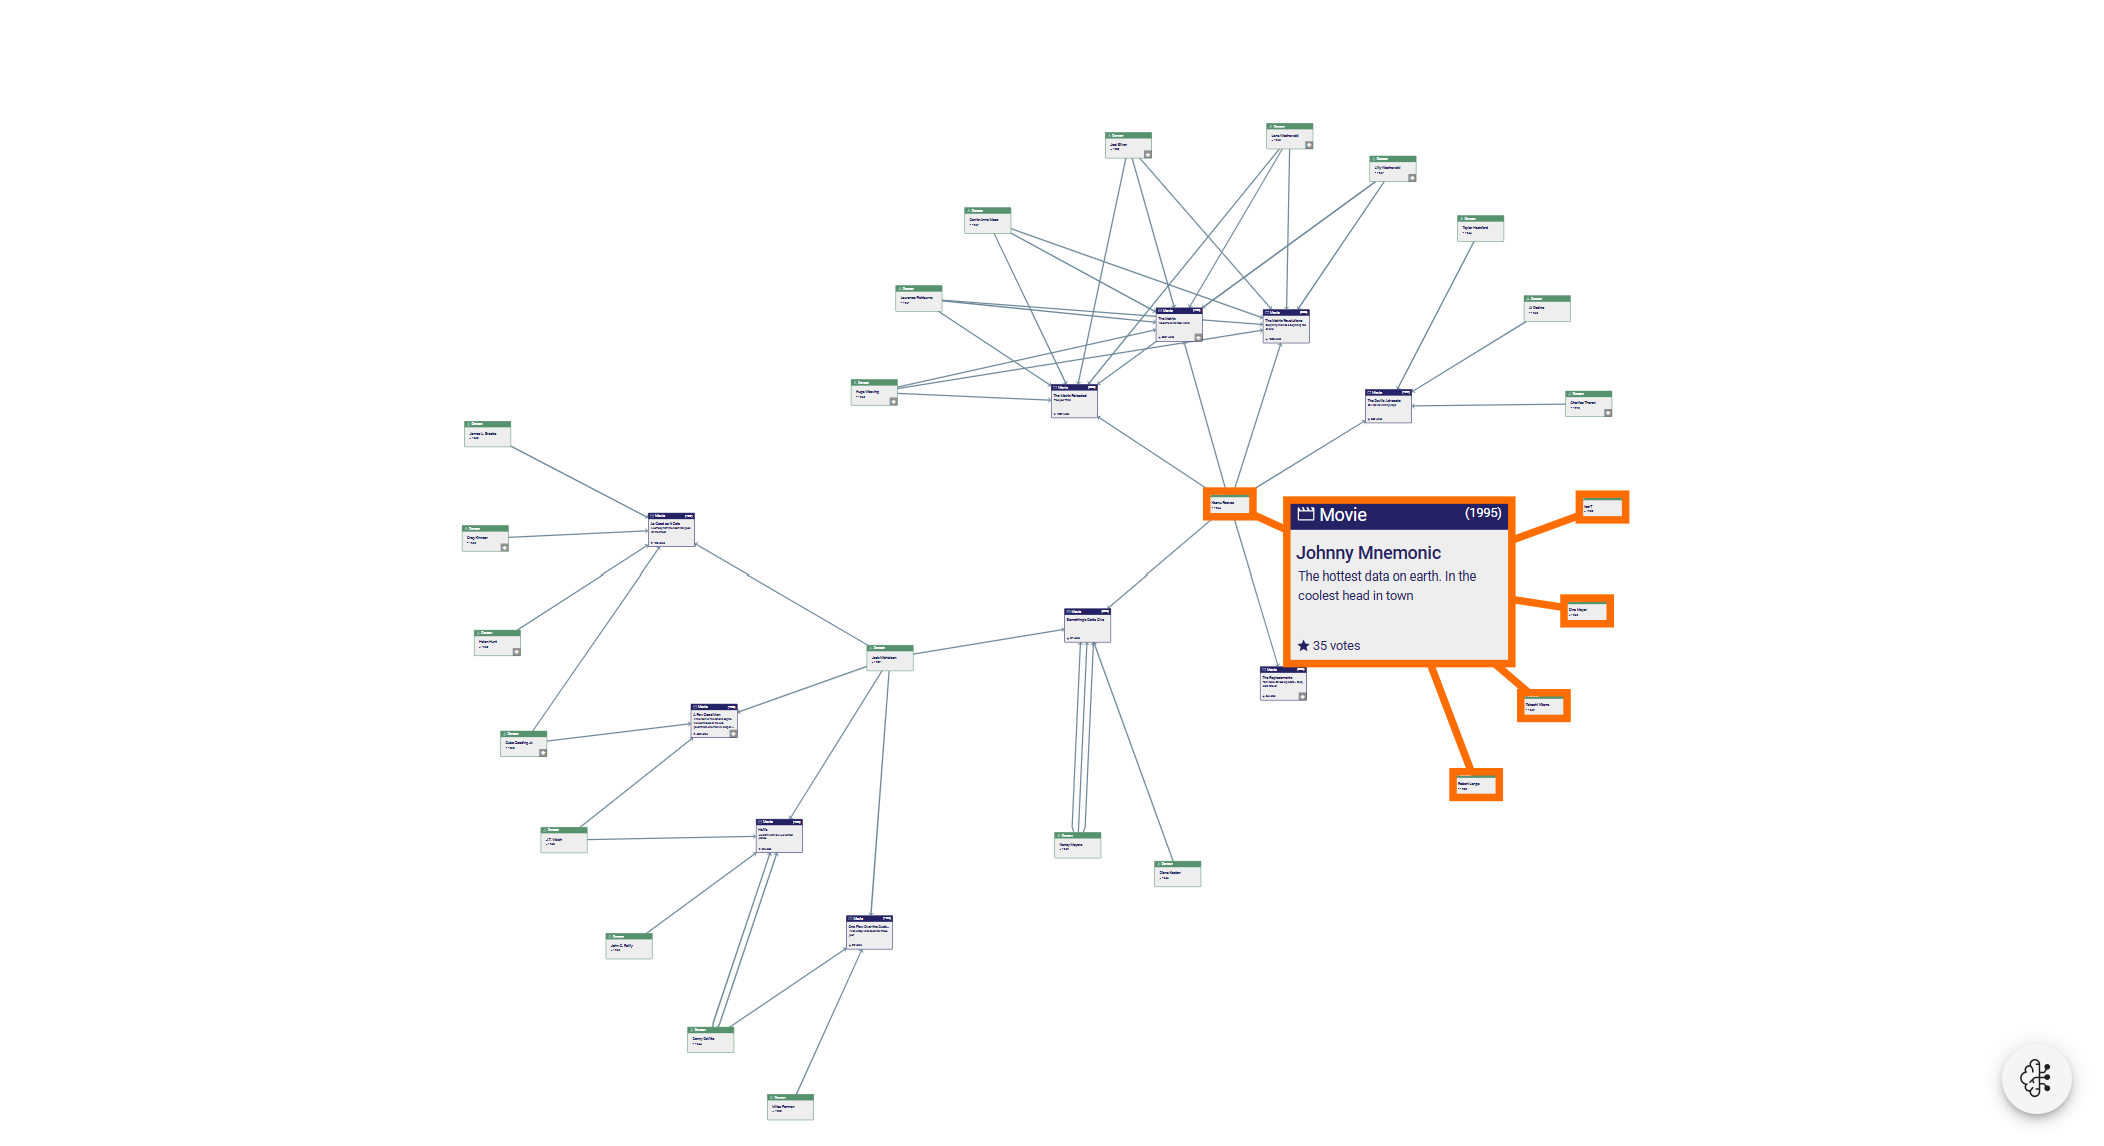
Visual representations of different database types
Dynamic interaction & exploration
Go beyond static images—enable grouping, drill-down, and filtering to simplify and explore your data in depth. Support smooth navigation and editing with mouse, keyboard, or touch, and enhance the user experience through animated transitions and on-demand loading or aggregation of data.
Generating your own app with low-code tools
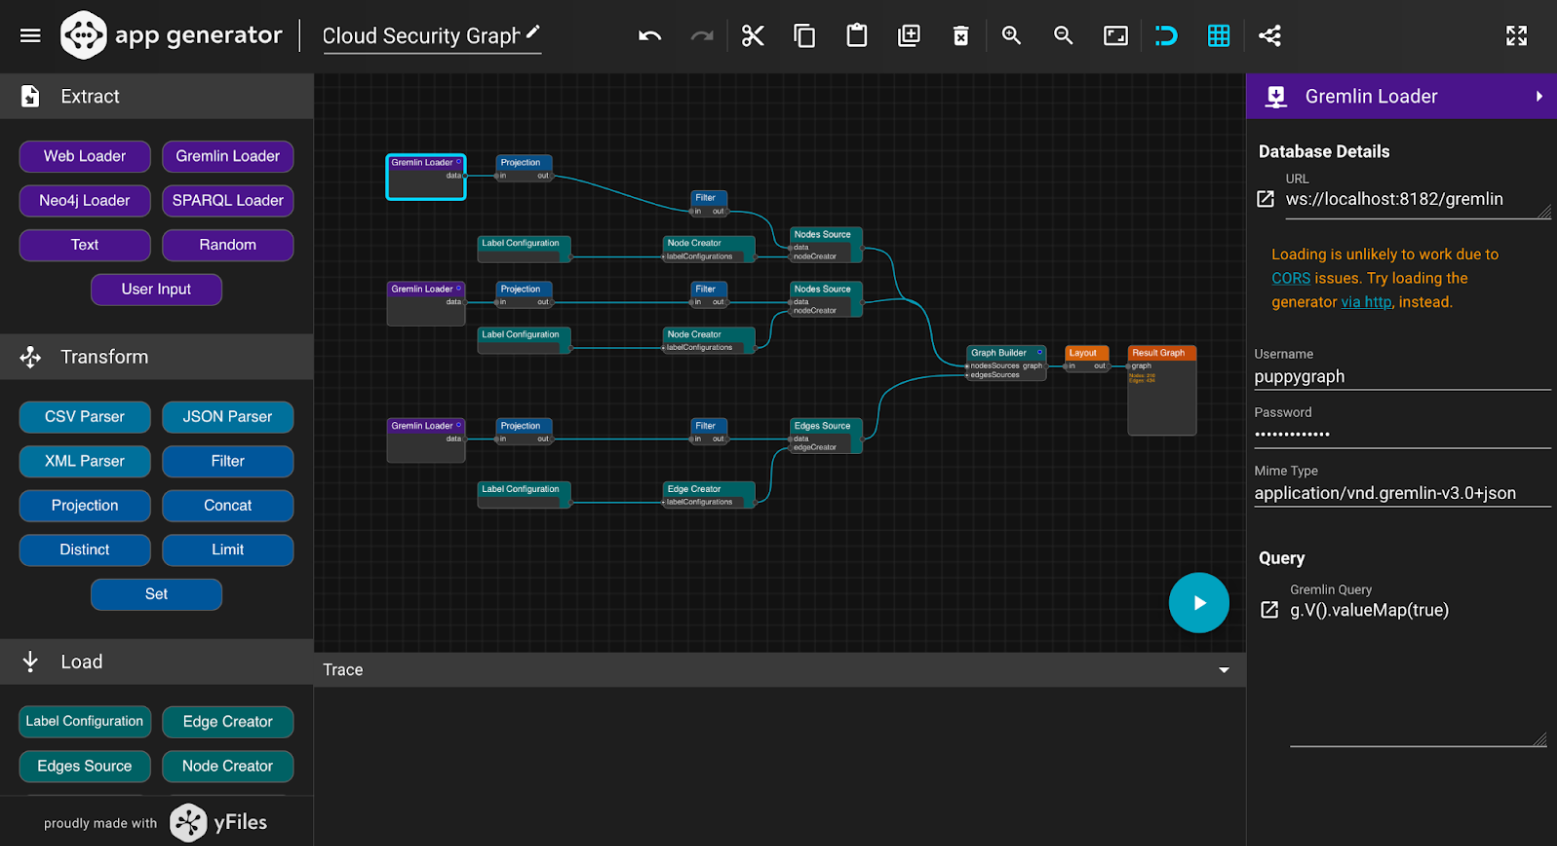
If you want to quickly scaffold your own application that connects to your database, consider using the App Generator for yFiles. It's a low-code tool that allows you to visually and interactively create graph visualization applications with a low-code approach. Generate a graph application in just ten minutes from scratch!
The generator is a web application that can be used without registration or sign-up at no fees.
Once you are done with the setup, you can have the app create a source code bundle of the application that you designed with your choice of programming language and UI framework. Combined the bundle with yFiles for HTML and create stand-alone applications or integrate the results into your existing apps and dashboards.
About yFiles: The graph visualization SDK
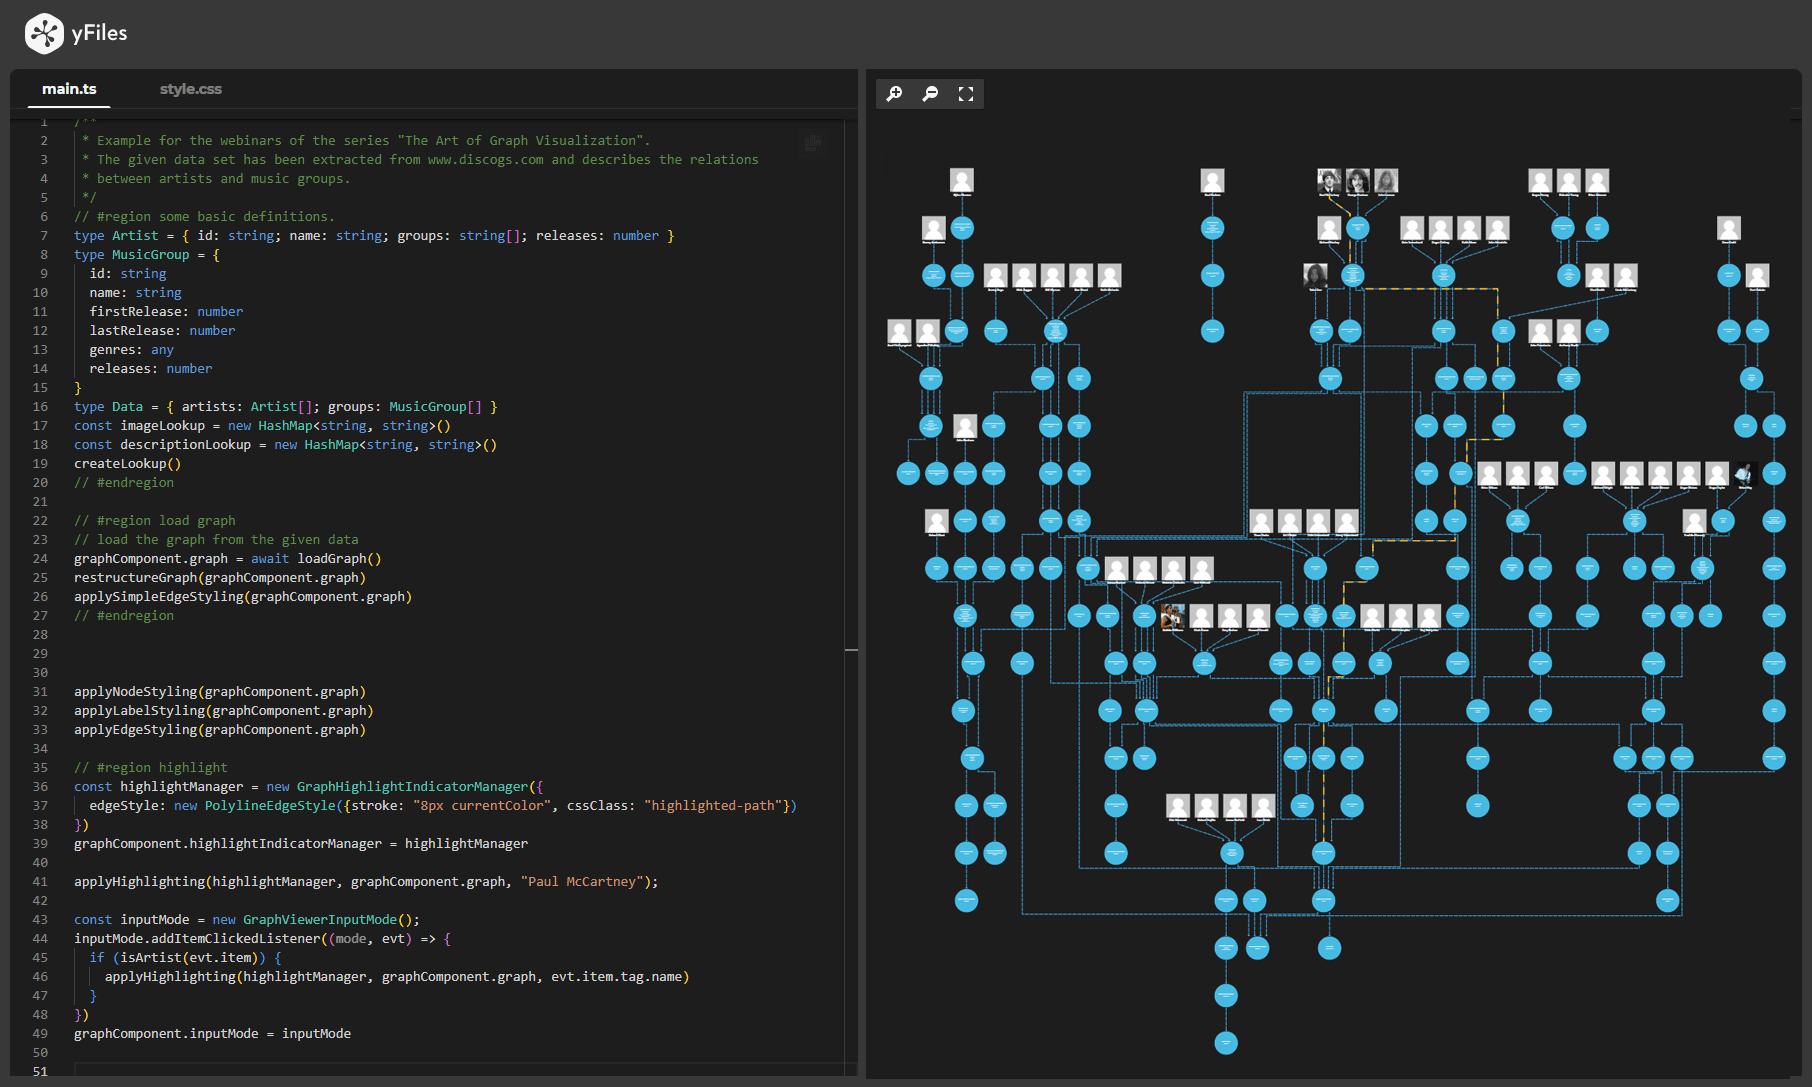
yFiles is your go-to SDK for crafting advanced graph visualizations, whether you're working with Web, Java, or .NET technologies. Its unmatched flexibility and scalability enable you to convert complex data into clear, actionable visuals, fitting for both enterprise and startup needs.
With yFiles, you're equipped for the future—supporting any data source while maintaining strong data security. Getting started is seamless, thanks to over 300 source-code demos, thorough documentation, and direct access to core developer support. These resources are available even during your free trial.
Backed by 25 years of graph drawing expertise, yFiles is trusted by top companies worldwide for their most critical visualization tasks.
Discover yFiles11 reasons why PuppyGraph developers trust yFiles!

yFiles Newsletter
Stay informed about yFiles, network visualization, and graph technology updates.
Join our newsletterStep-by-step guideHow to deploy and query PuppyGraph data for graph visualizations with yFiles
This guide outlines the core technical steps to launch a PuppyGraph instance using Docker and query its data with code for a visualization application.
Conclusion
By combining PuppyGraph with yFiles, you can go straight from raw data to interactive insight. This integration gives teams the speed, scalability, and clarity they need to understand complex relationships at scale—without waiting on stale snapshots or juggling disconnected tools.
Whether you’re working in security, fraud detection, telecom, or supply chain, PuppyGraph + yFiles brings powerful graph analysis and elegant visualization directly to your data lake.
Ready to see it in action? Download PuppyGraph’s forever-free Developer Edition and sign up for the free trial with yWorks.


